No hay dos trasera iguales. Siempre lo tenemos en cuenta.
Este pequeño y resumido informe se ha elaborado a las 17,30 hora peninsular española, sobre el selectivo índice S&P 500.
This is only a small sample of how we can help you. You think a report for our subscribers is much deeper and more personalized. No two backs alike. We always keep it in mind. This small, abridged report was prepared at 17.30 p.m. Spanish time, on the selective S & P 500 index.

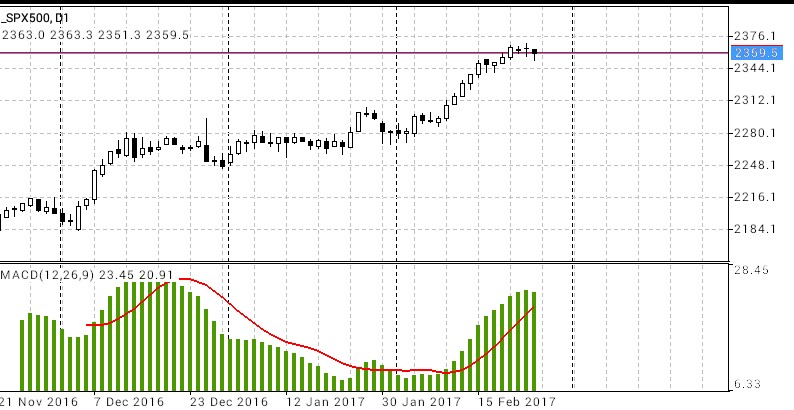
El patrón de velas no es definitivo. No obstante vemos en el punto más alto dos dojis (en especial el segundo) que nos alertan de un posible cambio de tendencia o corrección bajista.
The pattern of candles is not definitive. Nevertheless we see at the highest point two dojis (especially the second) that alert us of a possible change of tendency or bearish correction.

En el indicador Ichimoku observamos que la nube (kumo), aun está lejos del precio y confirma el movimiento al alza. El kumo superior (marrón) es un excelente punto para establecer soportes caso de caída del precio.
In the Ichimoku indicator we observe that the cloud (kumo), is still far from the price and confirms the upward movement. The upper (brown) kumo is an excellent point to establish supports case of falling price.

Las Bandas de Bollinguer nos avisan de una posible creación de un nuevo objetivo por parte del mercado. Este objetivo podría ser alcista o bajista.
Caso de ser bajista, tomemos como referencia los niveles de la banda central.
The Bollinguer Bands warn us of a possible creation of a new objective by the market. This target could be bullish or bearish. In case of being bearish, let us take as reference the levels of the central band.

Las medias móviles no nos muestran información relevante en el periodo diario. Pero en el gráfico de 4 horas, nos alertan de un posible cruce a la baja si el precio cede a la presión. Dicho cambio podría producirse en 2-3 días.
Moving averages do not show us relevant information in the daily period. But on the 4-hour chart, we are alerted to a possible downtrend if the price yields to pressure. Such change could occur in 2-3 days.

MACD confirma que la fuerza de la tendencia remite. Pero para que sea más fuerte el cambio. La línea de señal roja ha de envolver el histograma y conducirlo hacia abajo.
MACD confirms that the strength of the trend recedes. But to make the change stronger. The red signal line must wrap the histogram and drive it down.
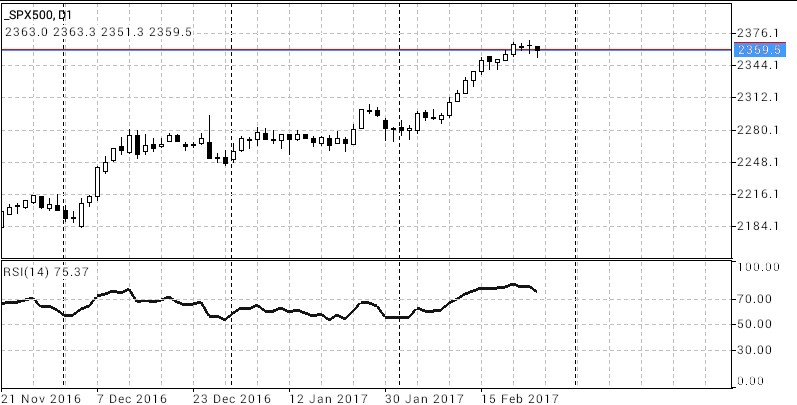
RSI está en niveles de sobre compra y se puede esperar que abandone los mismos. Muy atentos a esta posibilidad.
RSI is in overbought levels and you may be expected to abandon them. Very attentive to this possibility.
MFI confirma con su última línea marrón que hay un principio de cambio en el mercado pero este aún no se ha producido. Ni en volumen ni en precio.
MFI confirms with its latest brown line that there is a principle of change in the market but this has not yet occurred. Neither in volume nor in price.

La flecha verde indica el posible objetivo de una proyección bajista.
The green arrow indicates the possible target of a bearish projection.

En este otro gráfico vemos un escenario alternativo. Si el precio se toma un descanso. Y sus oscilaciones duran dos o tres días mas, podríamos estar ante un patrón alcista (bandera).
In this other graph we see an alternative scenario. If the price is taken a break. And its oscillations last two or three more days, we could be facing a bullish pattern (flag).

No hay comentarios:
Publicar un comentario